Last updated: March 2026
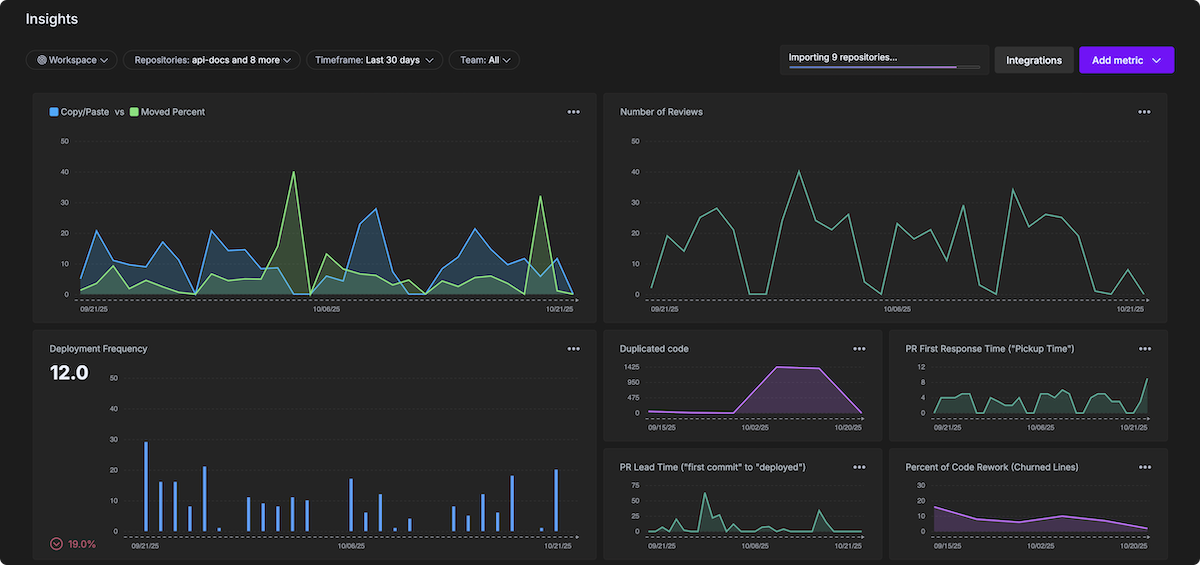
GitKraken Insights turns raw Git data into clear, useful metrics for developers and leaders. It pulls code activity, pull requests, issues, and CI/CD results into a single view that fits directly into existing workflows.
GitKraken Insights is available as an add-on to GitKraken subscriptions, or as a standalone product. Access is granted by request through the GitKraken team.
Quick Start
To get started:
- Request access at gitkraken.com/insights. The GitKraken team will enable access for your organization.
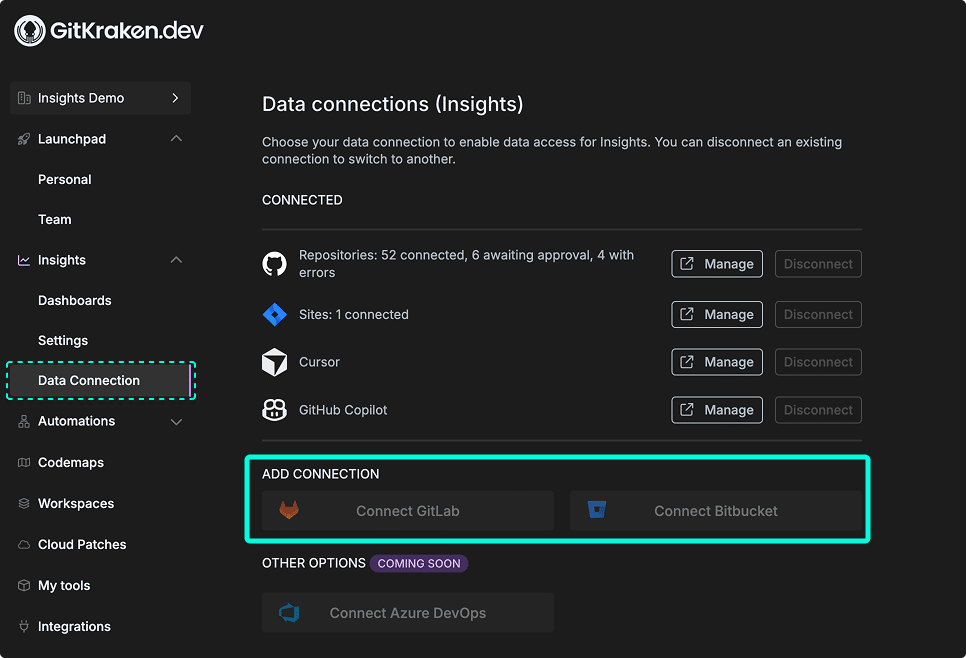
- After access is approved, go to Insights > Data Connection in gitkraken.dev.
- Connect GitHub, GitLab, or Bitbucket and authorize GitKraken Insights.
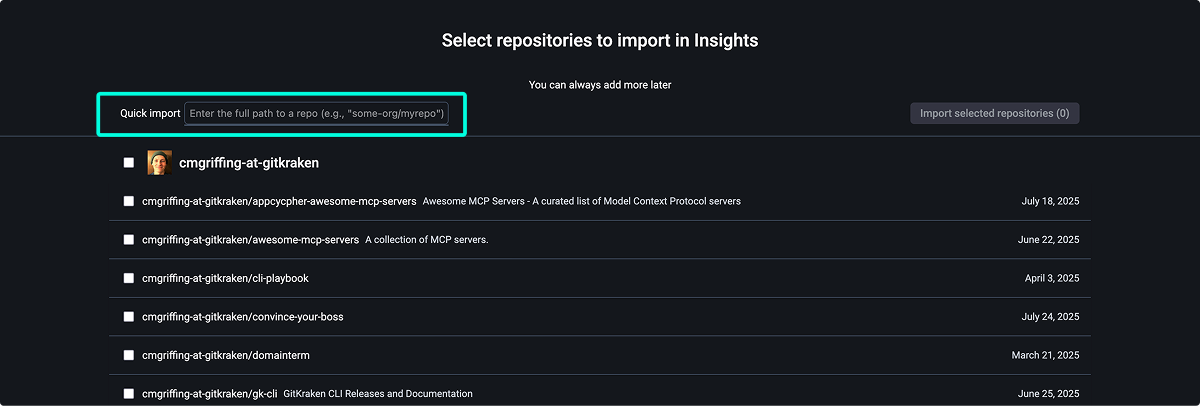
- Select the repositories to import, then click Import.
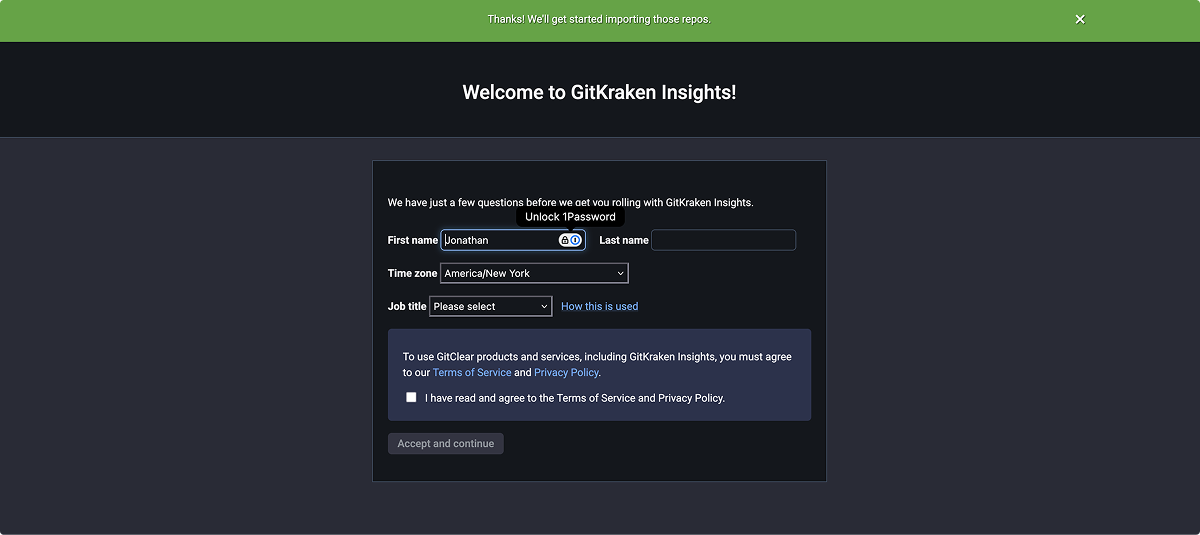
- Confirm your name, time zone, and job role to complete setup.
Past month activity appears within a few hours. Full year history is ready within one to two days. Track import progress from the Dashboard tab.
To avoid GitHub API rate limits during large imports, have additional organization members with the Lead role connect their GitHub tokens to distribute processing load.
Request Access
GitKraken Insights is available by request only. To get started, request a guided tour.
A member of the GitKraken team will contact you right away to walk you through Insights and explain how to enable access for your organization.
Note: Insights is available as an add-on to the seats in your existing GitKraken subscription, or as a discounted standalone solution for developers on your team who don’t use GitKraken.
Connecting your data
Once your access is approved, you can connect Insights to your repositories and configure settings for your organization.
Currently, Insights supports connections with GitHub, GitLab, Bitbucket, Azure DevOps, and Jira Cloud.
In addition, you can connect AI providers to enable AI Impact insights (like Duplicated Code, Prompt Acceptance Rate, and more).
| Data Source | Type | Status | Auth Method |
|---|---|---|---|
| GitHub | Git provider | GA | OAuth via GitKraken Insights |
| GitLab | Git provider | GA | OAuth via GitKraken Insights |
| Bitbucket | Git provider | GA | OAuth via GitKraken Insights |
| Jira Cloud | Issue tracker | GA | OAuth via GitKraken Insights |
| Azure DevOps | Git provider | GA | OAuth via GitKraken Insights |
| Cursor | AI provider | GA | API token |
| GitHub Copilot | AI provider | GA | API token |
How to import repositories
- In GitKraken.dev, go to Insights > Data Connection.
- Click to connect with GitHub, GitLab, Cursor, GitHub CoPilot, Azure Devops, Bitbucket or Jira Cloud.
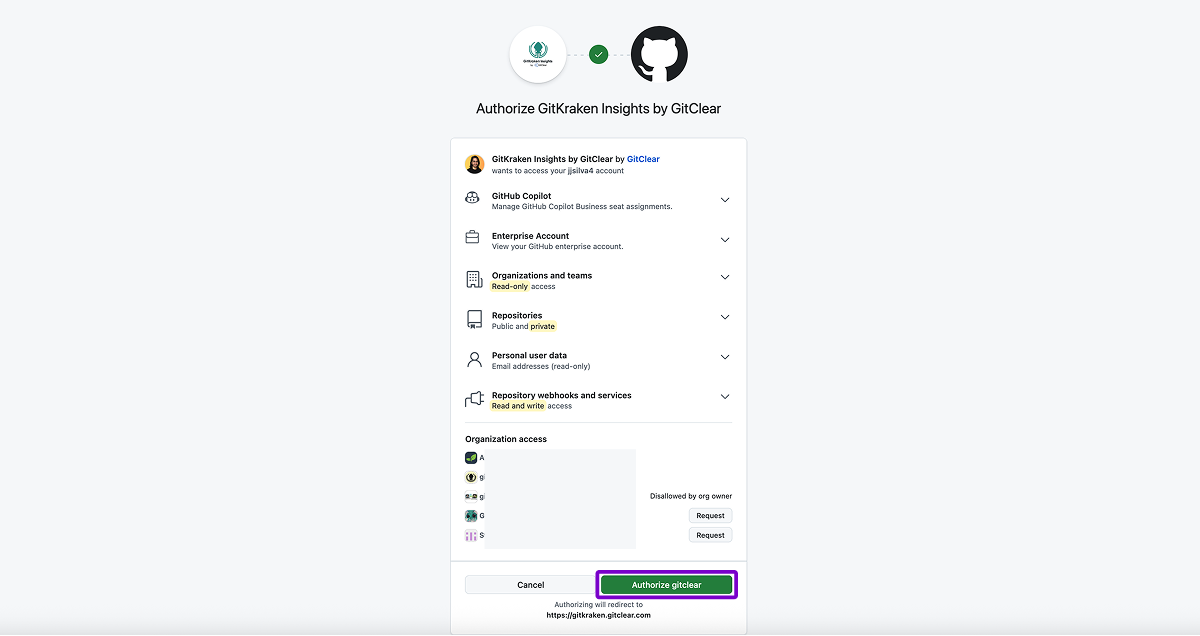
- Authorize GitKraken Insights to connect with GitHub. (GitKraken Insights is powered by GitClear.)
- Select which repositories to track. Use the filter option at the top of the page to quickly narrow down the list.
Avoiding GitHub API rate limits
If you’re importing a large number of repositories—depending on size and commit history—you may encounter GitHub’s hourly API rate limits. This can temporarily throttle other GitHub services used by your organization.
To avoid this, additional members of your organization can connect to Insights using a Lead role. When multiple people are connected, the app distributes processing across their GitHub tokens to help avoid throttling.
After the initial import is complete, rate limit issues are unlikely to recur.
AI Provider Connection (Optional)
As of December 2025, GitKraken Insights only supports connections with Cursor and GitHub Copilot to enable AI insights.
To enable AI Impact insights, connect your preferred AI provider:
- In GitKraken.dev, go to Insights > Data Connection.
- Click to
Managewith Cursor or GitHub Copilot. - In the new window, select the AI provider you wish to connect with and enter the provider Token.
- Click Connect AI Provider to finish the connection.
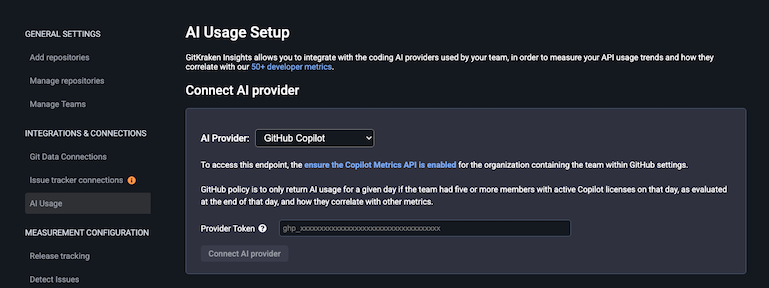
Connect your AI provider to enable AI Impact insights
How to set your role and time zone
After connecting repositories, confirm your personal details:
- First and last name
- Time zone
- Job role
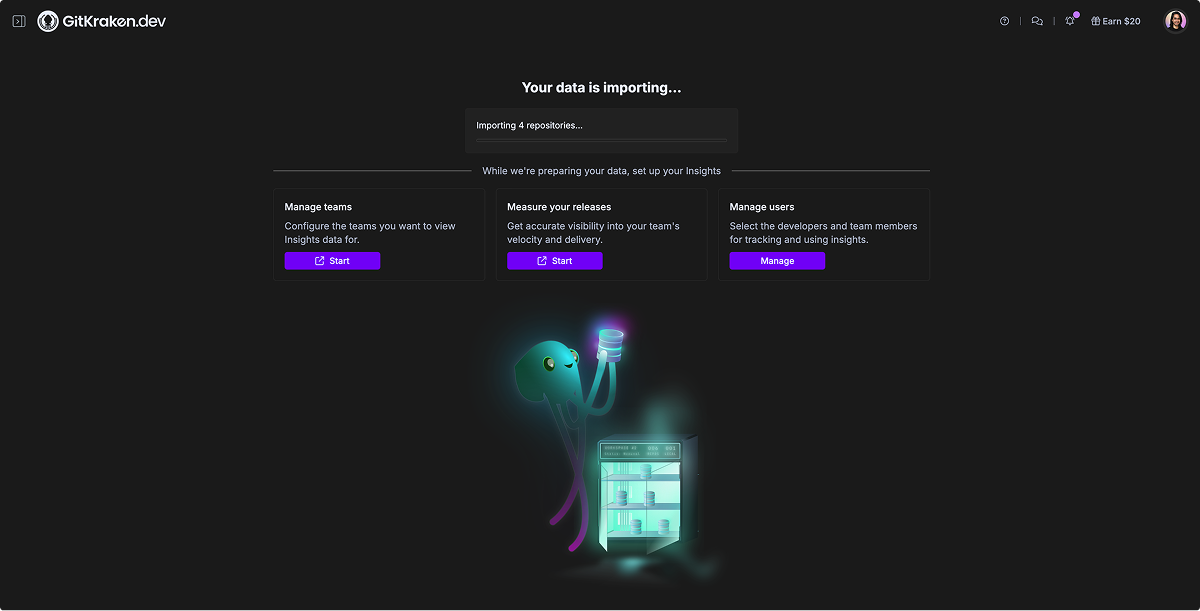
How to track data import progress
Once setup is complete, Insights will begin importing your repository data.
- Expect past month’s activity to appear within a few hours.
- Full year’s activity is usually ready within one to two days.
- Track import progress anytime from the Dashboard tab.